
Data Dynamics
A blog by Chris Morano
data scientist, classical pianist,
curious explorer
Helping the Mining Conglomerate Dig Deeper into their Data
When Maiko Sell, a Senior Project Geoscientist with Rio Tinto, presented his proposal to our Master of Data Science class at the University of British Columbia, I was hooked. Maiko is involved with finding new opportunities at Rio Tinto and has become increasingly interested in leveraging data science techniques to help him do this. Decision-makers in this industry are often asked to invest a king’s ransom on early-stage mining prospects based on very limited knowledge. Given this fact, it seemed that there was enormous potential to contribute something of value that could be used to make better business decisions within the company. I rated this project as my top choice and was grateful when I was assigned to work with Maiko at Rio Tinto.
Our group consisted of four Master’s students: Kitson Swann, Nada Salem, James Henry and myself. One part of our project consisted of creating a dashboard in R Shiny that would combine two datasets (S&P’s drill results dataset and S&P’s resource and reserves dataset), visualize various metrics, and plot the drill results on a map of the Americas. The dashboard we created was interactive, allowing users at Rio Tinto to see how drill results for chosen companies or projects compared to the overall distribution of results. Users could choose which commodity to display and subset the results by date, by soil deposit type, and by the depth of the drill intervals, among many other options.
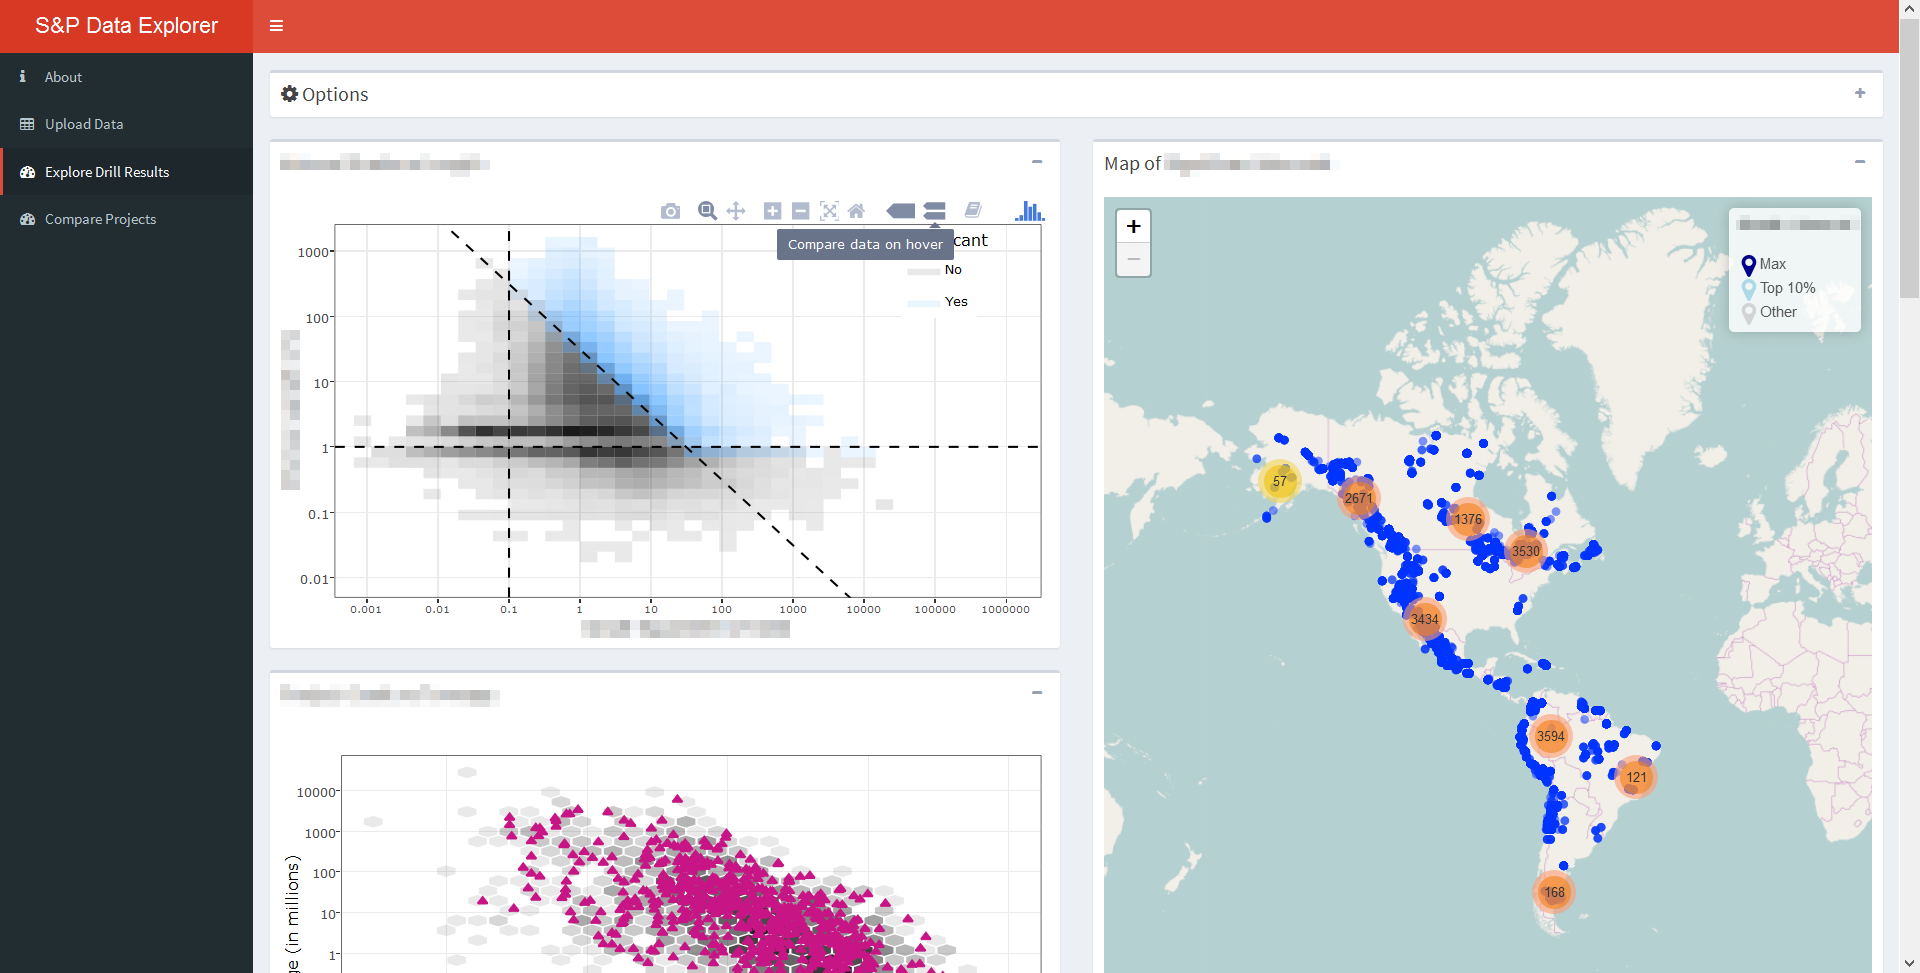
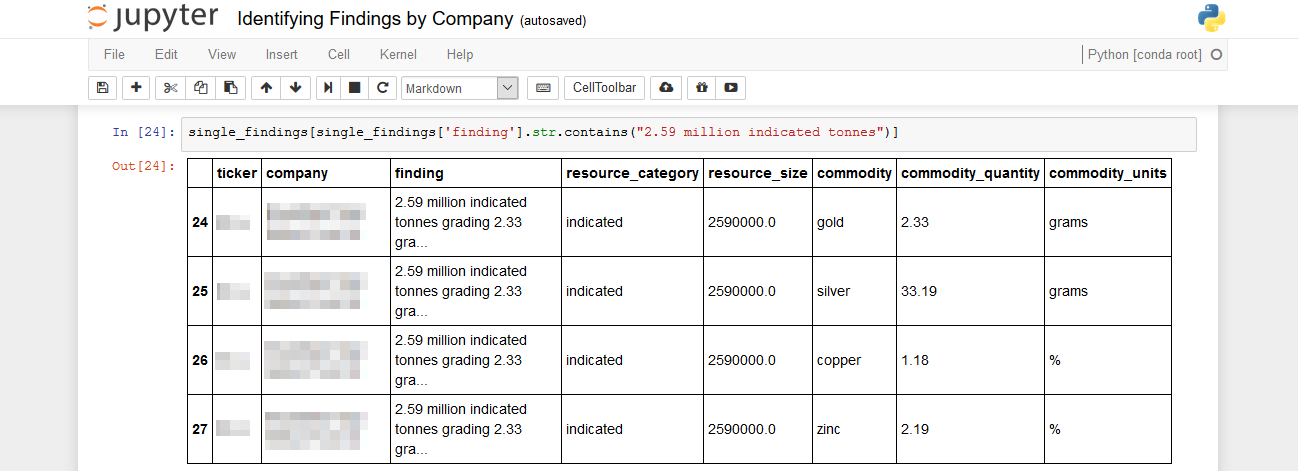
The drill results used for this dashboard were drill intervals available to any company licenced to use S&P data. This was problematic since Rio Tinto’s goal would be to get ahead of their competitors. To truly find new opportunities, they needed to also have access to up-to-date information on an ongoing basis. To achieve this, we were asked to create a prototype to extract relevant information from news articles, so that this data could be added to the datasets. Using Python’s Natural Language Toolkit, we wrote a script that extracts this information from an RSS news feed, parses it, and outputs it to a pandas dataframe. (Credit to Kitson for writing the final script seen below.)
Once these two parts of the project were well underway, we began working on creating three separate models to answer some larger business questions. The questions we tried to answer were:
1) Can we find early-stage projects that resemble profitable established projects?
2) Can we identify companies whose total market capitalization appear to be undervalued?
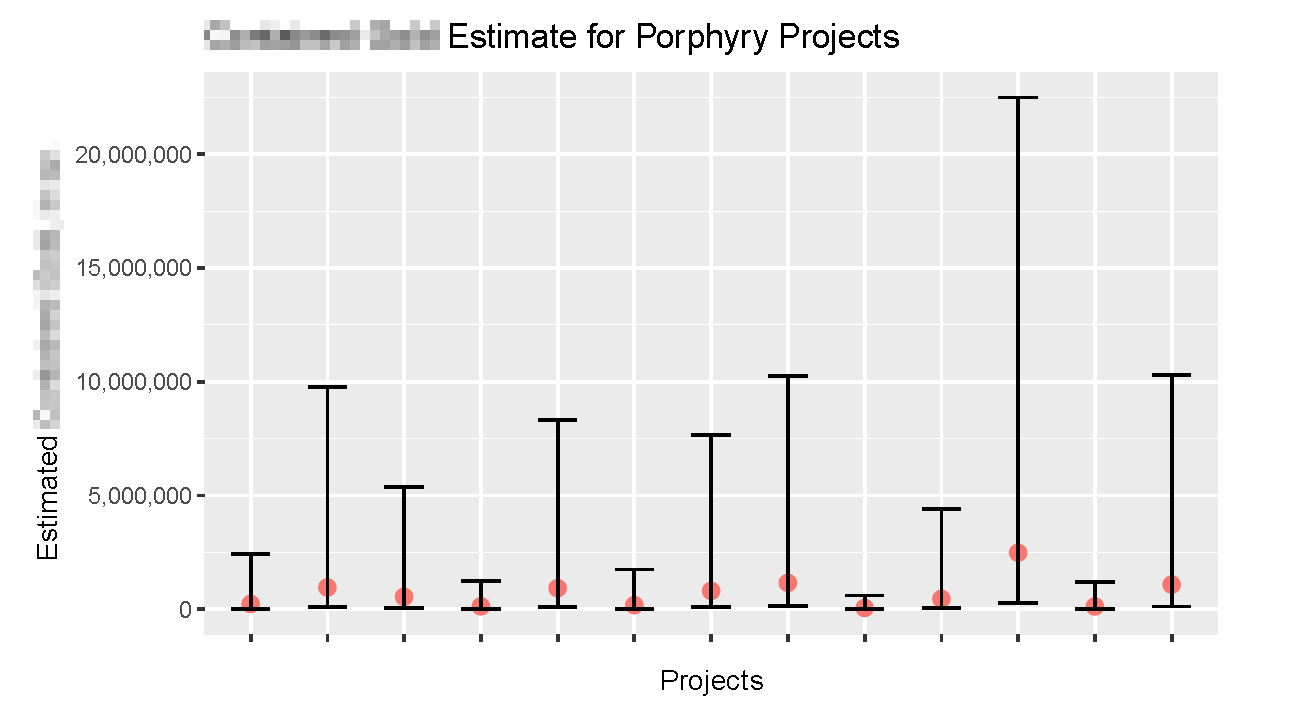
3) Can we estimate contained metals for projects that have not reported an official estimate?
While James and Nada tackled the challenges of streamlining our dashboard and dealing with scalability issues, Kitson undertook the modelling for questions 1 & 2, while I delved into model creation to address question 3.
Without getting into feature selection (to not give away the models we created for Rio Tinto), I can say that we used k-NN models to help find similar early-stage projects. Our dashboard displays both a data table listing the similar projects as well as various plots tracking their similarity over time. The second model was more difficult and time didn’t quite allow for the rigorous model-building needed to tackle it sufficiently.
To address our third business question, our team, along with our UBC supervisor Dr. Vincenzo Coia, came up with numerous ways to model the contained metals of a project. We considered modelling the area of the resource first, then trying to model its volume before estimating the gold present in gold deposits. I created and compared numerous linear regression model and convolutional neural nets to see if I could find a more direct proxy for 3D kriging. (3D kriging is one of the main ways that a resource is measured, involving more data and experienced engineers.) In the end, our models suffered from a lack of sufficient data. We were able to get point estimates and 95% confidence intervals for contained metals, which was indeed a success. However, our confidence intervals were quite wide. Sufficed to say, our team was unfortunately not able to replace a roomful of mining engineers.
There were many other challenges in this project that were not apparent when we began, but became clear as we learned about how those in the mining industry report their data. It was sometimes a challenge to understand why certain metrics were important, why the geological ore type of a deposit would make a difference to our models, or how to deal with duplicates in the data that were not obviously duplicates. In two months, however, my team delivered something valuable to Rio Tinto: a tool to visualize their data and models to help them identify potential opportunities. We are very grateful for their help in making our Capstone project successful.